Longitudinal analysis of the gut microbiome in adolescent patients with anorexia nervosa: microbiome-related factors associated with clinical outcome
COMMENTED ARTICLE Children’s section
By Pr. Emmanuel Mas
Gastroenterology and Nutrition Department, Children’s Hospital, Toulouse, France
Lay public section
Find here your dedicated section
Sources
This article is based on scientific information
Sections

About this article
Comments on the original article by Andreani et al. [1]
The gut microbiome is increasing recognised as playing a role in anorexia nervosa (AN). Studies have reported that AN patients present with dysbiosis compared to healthy controls. However, the underlying mechanisms are unclear and data on influencing factors and the longitudinal impact of microbiome alterations are rare. In this article, the authors presented longitudinal data from 57 hospitalised adolescents diagnosed with anorexia at nine different time points (including a one-year follow-up examination) and compared them to six different time points in 34 healthy controls. The study concluded that characterising prognostically relevant taxa could help stratify patients at admission and potentially identify candidate taxa for future supplementation studies to improve the treatment of anorexia nervosa.
What do we already know about this subject?
Anorexia nervosa (AN) is a very common psychiatric condition in adolescence, with a high mortality rate. AN is characterised by dysmorphia, reduced calorie intake and malnutrition. Although the pathophysiology of AN is poorly understood, the gut microbiome (GM) is thought to play an important role. GM is actually involved in the gut-brain axis, in malnutrition and also in excess weight, and is altered by diet. The aim of the study was to analyse GM alterations over time in AN patients. It was a one-year study conducted on inpatients until they were discharged from hospital, with an assessment of the clinical parameters associated with the GM in AN.

What are the main insights from this study?
This is the first longitudinal study on gut microbiome (GM) alterations in AN patients, conducted over such a lengthy time frame (one year). The study included 56 patients aged between 12-20 years and 34 controls. Stools were collected at admission and discharge (T0-T7) then one year after admission (T8). Eight patients were re-admitted during the study; patients were separated into those who had recovered their weight (BMI≥15th p [percentile]) and those who still had a low weight (BMI<15th p).
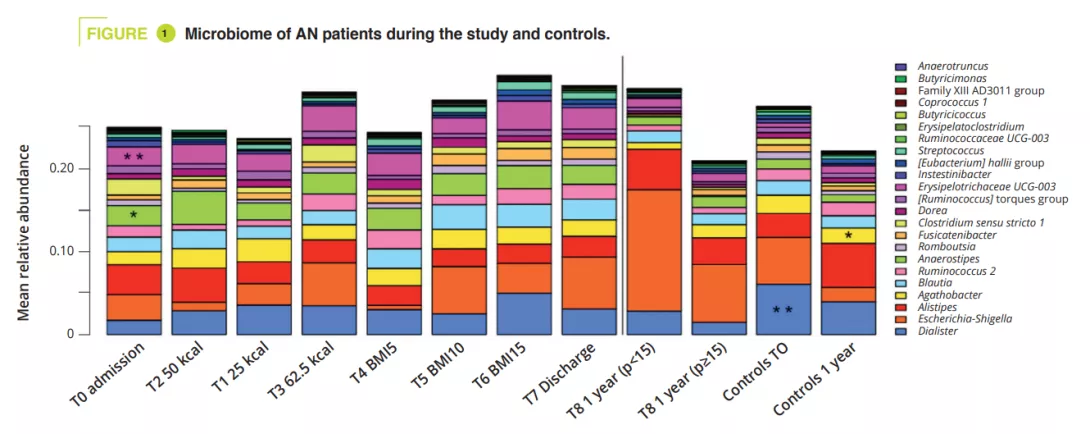
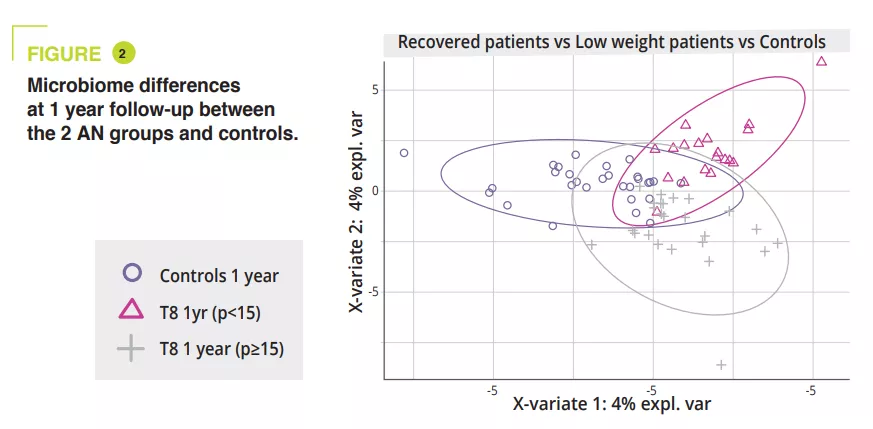
GM composition differed significantly at admission during the acute malnutrition phase, with no difference in terms of alpha-diversity (figure 1). GM differences observed in AN patients compared to controls, even when non-significant, persisted throughout the study. In adolescents with a BMI<15th p at one year, alpha-diversity (Chao1 index) was significantly reduced during hospitalisation compared to admission, discharge and at the 1-year follow-up. A similar trend was observed in AN patients who recovered a BMI≥15 compared to the controls. At admission, the PERMANOVA analysis showed a significant reduction in the genera Legionella, Dialister, Ruminococcaceae UCG-003 and Limnobacter compared to the controls. During in-hospital treatment, the differences between AN patients and controls were reduced, and only remained in the amplicon sequences variants (ASVs). At one year, significant differences were still observed between AN patients with a BMI<15th p and controls in terms of the phyla, classes and orders (p = 0.001 to <0.001), whereas smaller differences were observed between AN patients with a BMI≥15th p and controls (p = 0.063 in terms of ASVs) (figure 2).

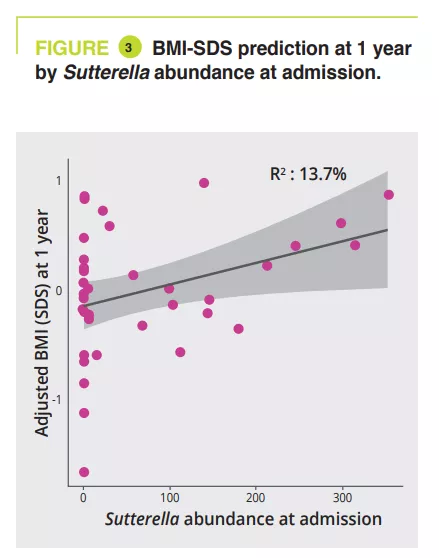
Between admission and the 1-year follow-up, AN patients with a BMI<15th p had a significant abundance of the genera Anaerostipes, Clostridium sensu stricto 1 and Romboustia (p = 0.02) while surprisingly, the GM of AN patients who recovered a BMI≥15th p was more similar during the follow-up. The same was true for changes in GM between hospital discharge and the 1-year follow-up: with a four fold greater abundance of the genus Escherichia-Shigella (p = 0.04) and two fold greater abundance of Alistipes (p = 0.03) in AN patients with a BMI<15th p. GM analysis at admission revealed a significant association between illness duration (phylum-family level, p = 0.011 to 0.022) and amount of weight loss (class-genera level, p = 0.030 to 0.047). A longitudinal PERMANOVA analysis, with correction for the use of laxatives, showed a significant association between GM and the amount of ingested calories (p = 0.003, R2 = 0.009), the BMI-SDS (p = 0.006, R2 = 0.008) and leptin concentration at admission, discharge, and 1-year follow-up (p = 0.02, R2 = 0.02). The genera Ruminiclostridium 5 (p=0.006) and Intestinibacter (p= 0.03) were associated with the risk of hospital readmission. A linear model analysis, with correction for laxative use, illness duration, weight loss and BMI-SMS at admission, identified that at admission four genera were associated with BMI-SDS at the 1-year follow-up: Sutterella, Parasutturella, Lachnospiraceae FCS020 group and Clostridium stricto sensu (p = 0.008 to 0.04) (figure 3).

What are the consequences in practice?
Dysbiosis is observed in acute-phase AN patients and improves partly with treatment. GM composition at admission can help predict the risk of relapse in the first year and improvement in BMI at one year. Thus, a GM analysis at admission could identify the genera and taxa Parasutturella, Lachnospiraceae FCS020 group, Clostridium stricto sensu and uncultured Alistipes as indicative of a poorer prognosis. As a higher abundance of Sutterella is indicative of a positive outcome, it could be used as a probiotic target.
- GM analysis could be worthwhile in adolescents with AN
- Certain microbes could be predictive of negative outcome factors while Sutterella could be positive and used as a probiotic target
CONCLUSION
This study showed that GM composition was associated with the duration of the AN and weight loss at admission, but also that GM alterations during treatment was influenced by the calories ingested, weight gain and leptin.

